Graphics
Matlab contains a large number of functions that plot data in 2D and 3D.
The most important is plot.
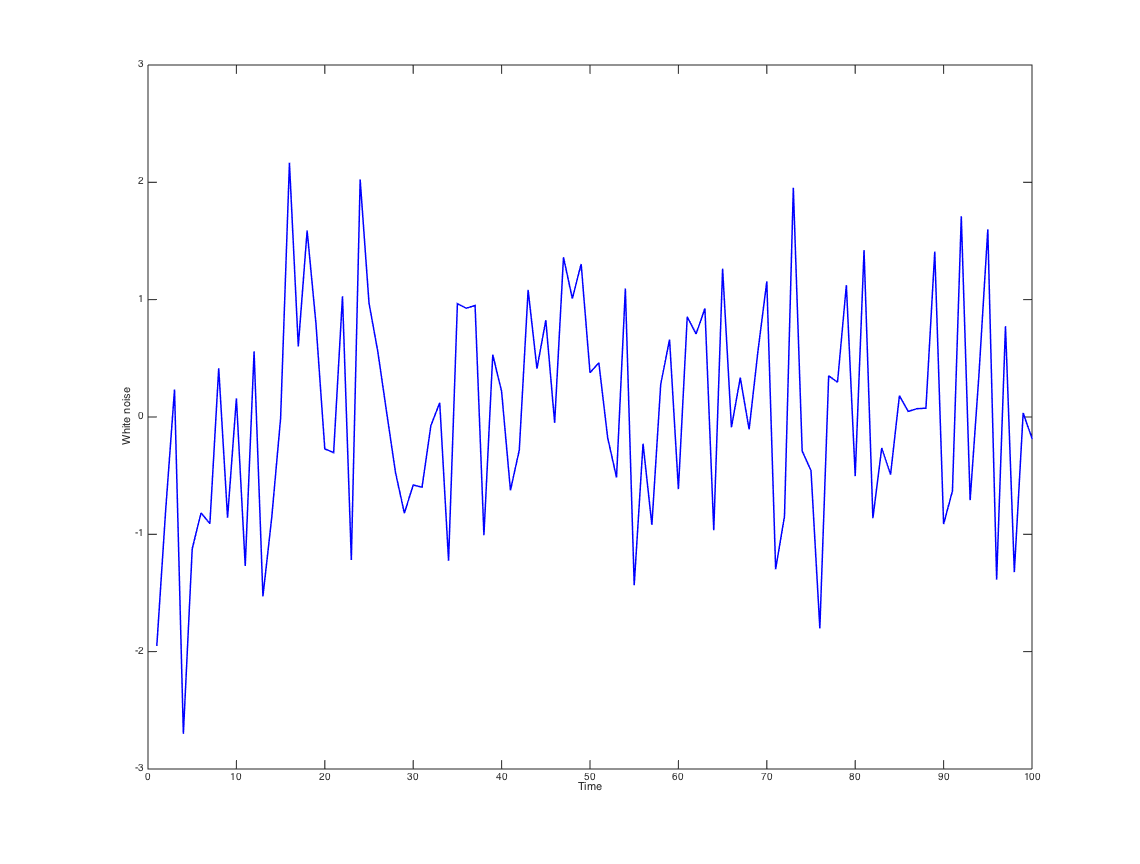
Example: Plotting a white noise process
% Seed the random number generator. For reproducability
rng(21);
% Draw iid normal random variables
xV = randn([100,1]);

% Line plot
%	'b-' specifies a blue solid line
%	fh is a file handle. It can be used to set plot options
fh = plot(xV, 'b-');

% Formatting
xlabel('Time')
ylabel('White noise')
The result: a poorly formatted figure (saved here by hand as png):
 figWhiteNoise
Saving Plots
Now for the bad news: Generating reasonably formatted plots in Matlab is surprisingly hard.
The only reasonable way of doing so uses Export_fig.
Even then it is complicated…